Blood flow measurement used to be a crappy function on color Doppler ultrasound. Now, with the continuous popularization of ultrasound in the field of hemodialysis vascular access, it has become a more and more rigid demand. Although it is very common to use ultrasound to measure the flow of fluids in industrial pipelines, it has not been paid much attention to the blood flow measurement of blood vessels in the human body. There is a reason for that. Compared with industrial pipelines, the blood vessels in the human body are buried under the skin which are invisible, and the diameter of the tube varies greatly (for example, the diameter of some vessels before AVF is less than 2mm, and some AVFs are more than 5mm after maturity), and they are generally vey elastic, which brings great deal of uncertainty to flow measurement. This paper makes a simple analysis of the influencing factors of flow measurement, and guides practical operations from these factors, thereby improving the accuracy and repeatability of blood flow measurement.
The formula for blood flow estimation:
Blood flow = averaged time flow rate × cross-sectional area × 60, (unit: ml/min)
The formula is very simple. It is just the volume of fluid flowing through the cross-section of the blood vessel per unit time. What needs to be estimated are the two variables-- the cross-sectional area and the average flow rate.
The cross-sectional area in the formula above is based on the assumption that the blood vessel is a rigid circular tube, and the cross-sectional area=1/4*π*d*d, where d is the diameter of the blood vessel. However, the actual human blood vessels are elastic, which are easy to be squeezed and deformed (especially the veins). Therefore, when measuring the diameter of the tube or measuring the flow rate, you need to make sure that the blood vessels are not squeezed or deformed as you can. When we scan the longitudinal section, force may be exerted unconsciously in many cases, so it is generally recommended to complete the pipe diameter measurement in the cross section. In the case that the transverse plane is not squeezed by external force, the blood vessel is generally an approximate circle, but in the squeezed state, it is often a horizontal ellipse. We can measure the diameter of vessel in the natural state, and get a relatively standard diameter measurement value as reference for subsequent longitudinal section measurements.
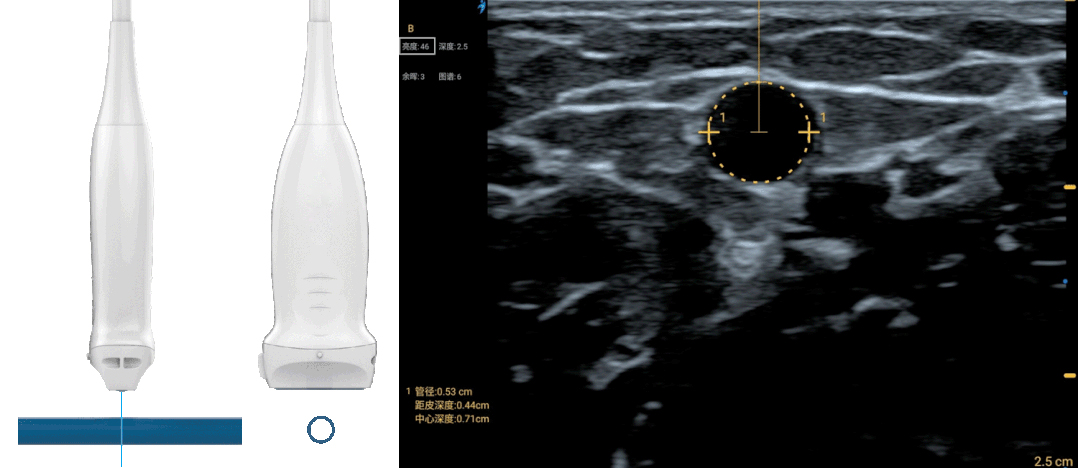
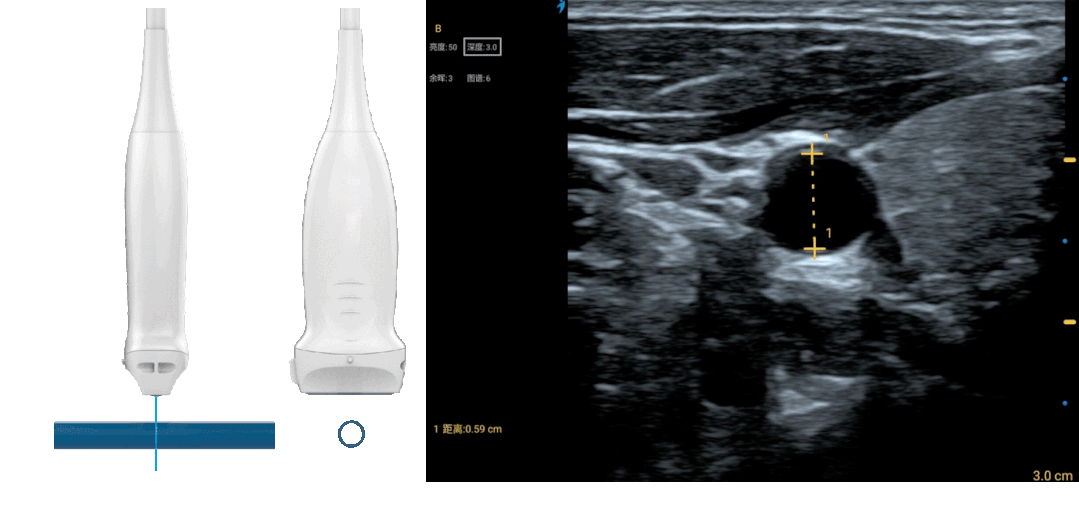
Besides avoiding squeezing the blood vessels, it is also necessary to pay attention to making the blood vessels perpendicular to the section of the ultrasound imaging when measuring the cross section of the blood vessels. How to judge whether the blood vessels are vertical since they are subcutaneous? If the imaging section of the probe is not perpendicular to the blood vessel (and the blood vessel is not squeezed), the obtained cross-sectional image will also be an erect ellipse, which is different from the horizontal ellipse formed by the extrusion. When the tilt angle of the probe is larger, the ellipse is more obvious. At the same time, due to the tilt, a lot of the energy of the incident ultrasound is reflected to other directions, and only a small amount of echoes are received by the probe, resulting in the brightness of the image being decreased. Therefore, judging whether the probe is perpendicular to the blood vessel through the angle that the image is brightest is also a good way.
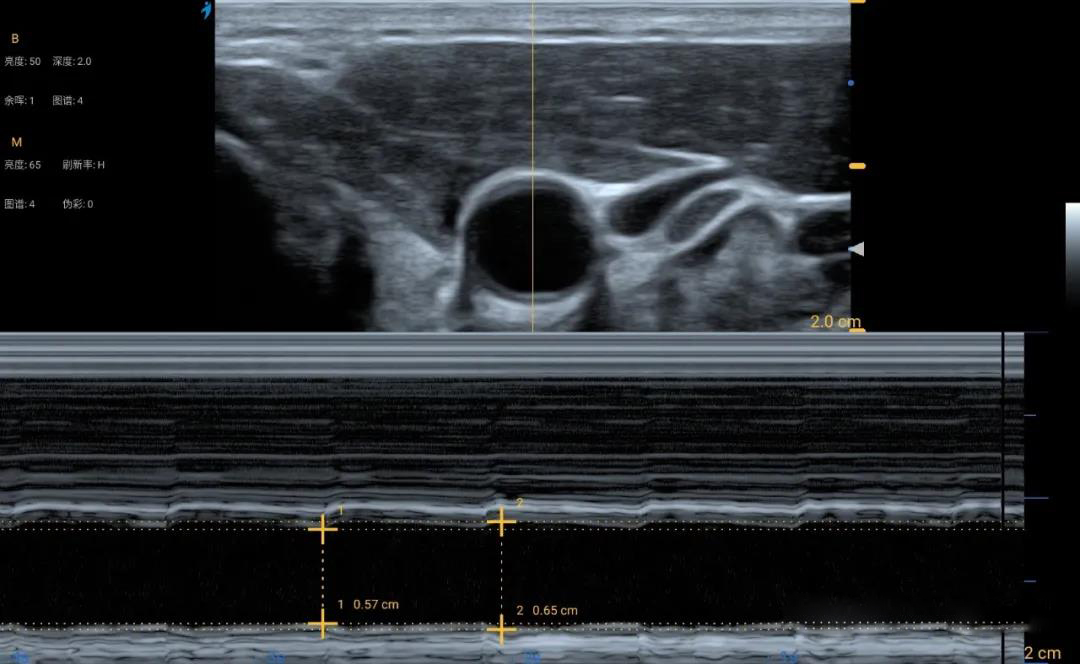
By avoiding distortion of the vessel and keeping the probe perpendicular to the vessel as much as possible, accurate measurement of the vessel diameter in cross-section can be easily achieved with practice. However, there will still be some variation in the results of each measurement. It is most likely that the vessel is not a steel tube, and it will expand or contract with changes in blood pressure during the cardiac cycle. The picture below shows the results of carotid pulses in B-mode ultrasound and M-mode ultrasound. The difference between systolic and diastolic diameters measured in M-ultrasound can be approximately 10%, and a 10% difference in diameter can result in a 20% difference in cross-sectional area. The hemodialysis access requires high flow and the pulsation of the vessels is more pronounced than normal. Therefore, the measurement error or repeatability of this part of the measurement can only be tolerated. There is no particularly good advice, so just take a few more measurements when you have time and choose an average.
Since the specific alignment of the vessel or the angle with the probe section cannot be known under the transverse view, but in the longitudinal view of the vessel, the alignment of the vessel can be observed and the angle between the direction of the vessel alignment and the Doppler scan line can be measured. So the estimation of the mean flow velocity of the blood in the vessel can only be done under the longitudinal sweep. The longitudinal sweep of the vessel is a challenging task for most beginners. Just like when a chef slices a columnar vegetable, the knife is usually sliced in the transverse plane, so if you don't believe me, try slicing asparagus in the longitudinal plane. When cutting asparagus longitudinally, to divide the asparagus into two even halves, it is necessary to put the knife carefully to the top, but also to ensure that the plane of the knife can just cross the axis, otherwise the knife will be hard, the asparagus should roll to the side.
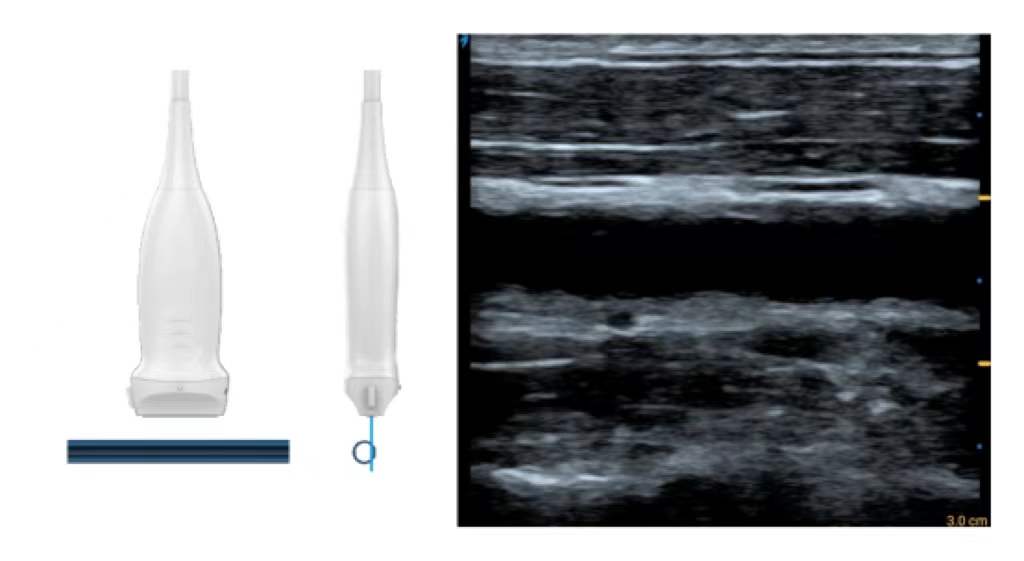
The same is true for longitudinal ultrasound sweeps of the vessel. To measure the longitudinal vessel diameter, the ultrasound section must pass through the axis of the vessel, and only then is the ultrasound incident perpendicular to the anterior and posterior walls of the vessel. As long as the probe is slightly lateralized, some of the incident ultrasound will be reflected to other directions, resulting in weaker echoes received by the probe, and coupled with the fact that the actual ultrasound beam slices (acoustic lens focus) are of thickness, there is a so-called "partial volume effect", which allows echoes from different locations and depths of the vessel wall to be mixed together, resulting in The image becomes blurred and the tube wall does not appear smooth. Therefore, by observing the image of the scanned longitudinal section of the vessel, we can determine whether the scanned longitudinal section is ideal by observing whether the wall is smooth, clear and bright. If an artery is scanned, the intima can even be clearly observed in the ideal longitudinal view. After obtaining the ideal longitudinal 2D image, the diameter measurement is relatively accurate, and it is also necessary for the subsequent Doppler flow imaging.
Doppler flow imaging is generally divided into two-dimensional color flow imaging and pulsed wave Doppler (PWD) spectral imaging with a fixed sampling gate position. We can use color flow imaging to perform a continuous longitudinal sweep from the artery to the anastomosis and then from the anastomosis to the vein, and the velocity map of color flow can quickly identify abnormal vascular segments such as stenosis and occlusion. However, for blood flow measurement, it is important to avoid the location of these abnormal vessel segments, especially anastomoses and stenoses, which means that the ideal location for blood flow measurement is a relatively flat vessel segment. This is because only in long enough straight segments can the blood flow tend to be stable laminar flow, whereas in abnormal locations such as stenoses or aneurysms, the flow state can change abruptly, resulting in eddy or turbulent flow. In the color flow diagram of a normal carotid artery and a stenotic carotid artery shown below, the flow in the laminar state is characterized by high flow velocity in the center of the vessel and reduced flow velocity near the wall, while in the stenotic segment (especially downstream of the stenosis), the flow state is abnormal and the flow direction of blood cells is disorganized, resulting in a red-blue disorganization in the color flow image.
Post time: Feb-07-2022


